This feature is in beta status. It should be used with caution.
Overview
Nebari integrates Kuberhealthy to perform internal healthchecks on Nebari. This is an extensible Kubernetes native framework for continuous synthetic testing. Kuberhealthy is set up to export metrics to Prometheus. This allows them to be seen in Grafana.
Enabling
Healthchecks are currently considered a beta feature that we are testing. Due to this, they are disabled by default. To enable healthchecks, add the following configuration under the monitoring configuration in your nebari-config.yaml.
monitoring:
  healthchecks:
    enabled: true
Checking status of Healthchecks
All healthchecks are exported as metrics to Prometheus and can be viewed in Grafana.
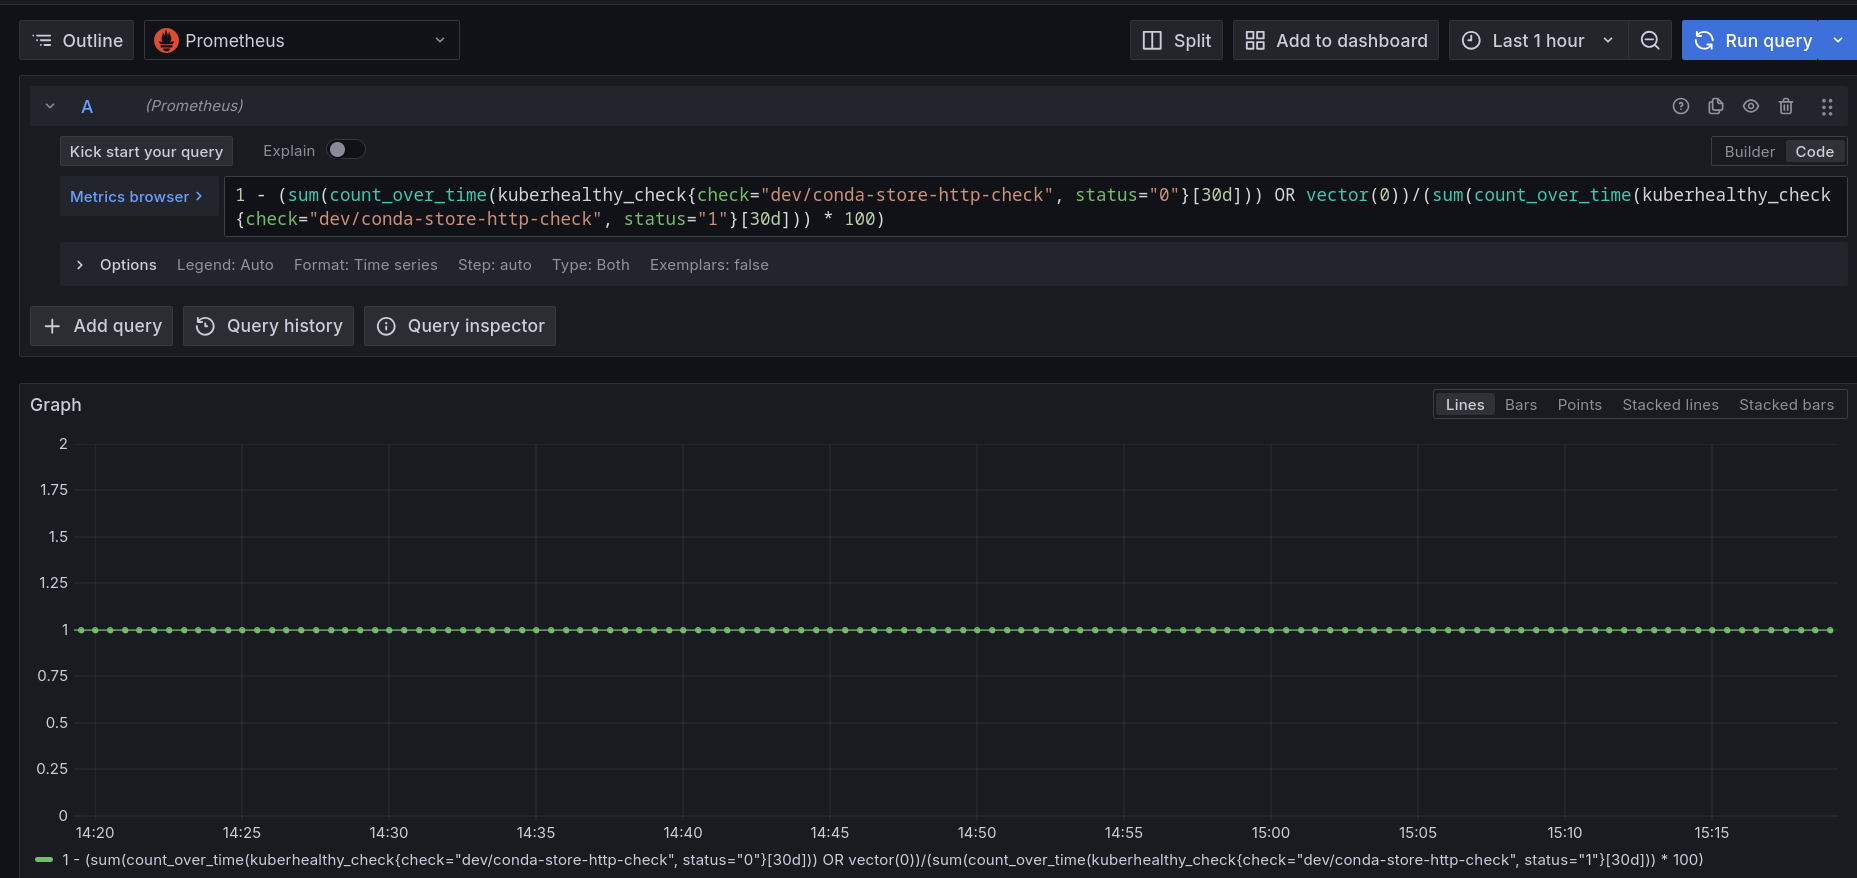
For example: To see the uptime for the conda-store service, you can run:
1 - (sum(count_over_time(kuberhealthy_check{check="dev/conda-store-http-check", status="0"}[30d])) OR vector(0))/(sum(count_over_time(kuberhealthy_check{check="dev/conda-store-http-check", status="1"}[30d])) * 100)
in Grafana, which will show you the following chart.
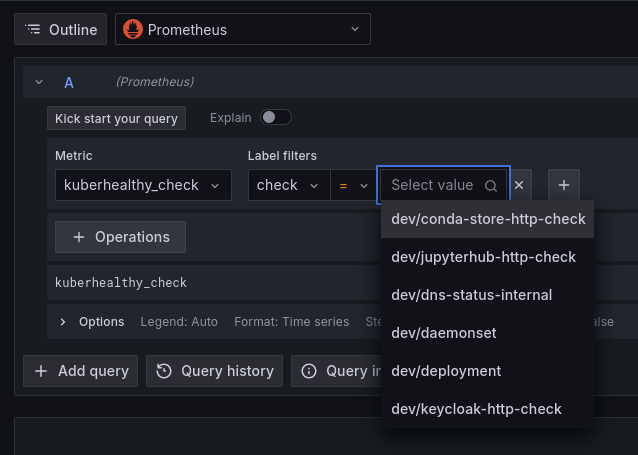
To see what other healthchecks are available, you can use the metric explorer in Grafana. Select the metric type of kuberhealthy_check and the label filter of check. The values list will be a list of the checks that
have metrics available.
If you have previously deployed Nebari without healthchecks, You may need to restart your Prometheus service to get it to pick up the kuberhealthy metrics.
Summary of available healthchecks
Below is an explanation of the available healthchecks. This list may not be comprehensive as work on this feature is ongoing.
Check Label | Description |
|---|---|
| conda-store-http-check | verifies that conda-store is accessible via it's REST API |
| jupyterhub-http-check | verifies JupyterHub is running |
| dns-status-internal | verifies internal DNS is accessible |
| daemonset | verifies that a daemonset can be created, fully provisioned, and torn down. This checks the full kubelet functionality of every node in your Kubernetes cluster |
| deployment | verifies that a fresh deployment can run, deploy multiple pods, pass traffic, do a rolling update (without dropping connections), and clean up successfully |
| keycloak-http-check | verifies Keycloak is accessible |