Create, deploy, and share dashboards and apps
Analyzing data with visualizations provides insights, and a dashboard stitches these insights into a meaningful story. There are many great open source dashboarding tools out there that you can use to organize and display your data in an engaging and digestible way.
In this tutorial, you'll learn how to create a new dashboard with Panel within Nebari. You'll also learn how to share your newly created dashboard with other users using JHub App Launcher.
JHub App Launcher was added in Nebari version 2024.1.1.
Until version 2023.7.1, Nebari used CDS Dashboards for dashboard sharing.
This page has instructions for both tools.
Since, CDS Dashboards is deprecated, the documentation will be removed soon.
Supported frameworks
This tutorial demonstrates a Panel dashboard built with HoloViews and Bokeh as the backend, but Nebari supports several other frameworks:
- JHub App Launcher
- CDS Dashboards
JHub App launcher supports Panel, Bokeh, Streamlit, Plotly Dash, Voila, Gradio, JupyterLab, and Any generic Python command.
In order to use JHub App to create apps, ensure it is enabled in your Nebari deployment. See the JHub App Launcher docs for instructions on enabling and using JHub App in Nebari.
CDS Dashboards supports Panel, Bokeh, Voila, Streamlit, and Plotly.
Create the dashboard
1. Create environment and notebook
Create a new environment in conda-store for your work with the libraries needed to run your notebook.
- JHub App Launcher
- CDS Dashboards
To use JHub Apps, your environment must include jhub-apps and the corresponding dashboard/app creation framework, in addition to other libraries required in the notebook.
Hence, for this tutorial:
- pandas
- panel
- holoviews
- bokeh
- jupyter_bokeh
- jhub-apps
When deploying an app via CDS Dashboards, you need to have cdsdashboards-singleuser installed in your environment. This allows your environment to show up on the environment options menu when creating your app.
Furthermore, with each framework, you will need to make sure that the specific framework you are deploying is installed. You will need to install streamlit for a streamlit app, panel for a panel app, etc.
Finally, when creating your app, make note of the packages you are using to run the app locally. These will also need to be added to your environment you will be using to create the dashboard.
For this tutorial:
- pandas
- panel
- holoviews
- bokeh
- jupyter_bokeh
- cdsdashboards-singleuser>=0.6.2
Launch JupyterLab in Nebari, create a new Jupyter Notebook with a meaningful name (such as panel-trees-dashboard.ipynb), and select the environment your created for this notebook from the select kernel dropdown (this dropdown menu is located in the top right corner of your notebook).
2. Create a panel dashboard
Copy the code below into a code cell of your notebook:
import pandas as pd
import holoviews as hv
from bokeh.models import HoverTool
import panel as pn

hv.extension('bokeh')
pn.extension()

# creating a sample dataset
data_trees = { 'species_name': ['live oak', 'pecan', 'bur oak', 'cedar elm'],
              'avg_diameter_inch': [20, 30, 40, 35]
            }

df = pd.DataFrame(data_trees)

# adding curve/line and bar plots
plot_bar = hv.Bars(df, 'species_name', 'avg_diameter_inch')
plot_curve = hv.Curve(df)

# creating hover tooltip
hover = HoverTool(tooltips=[("avg diameter", "@avg_diameter_inch"),
                            ("species", "@species_name")])
# plot customization
combine_plot = plot_bar.opts(tools=[hover]) + plot_curve.opts(line_dash='dashed')

# creating a dashboard using panel
pn.Row(combine_plot).servable()
You can run all the cells in your notebook and view the Panel dashboard using the "Preview with Panel" button in the notebook toolbar:
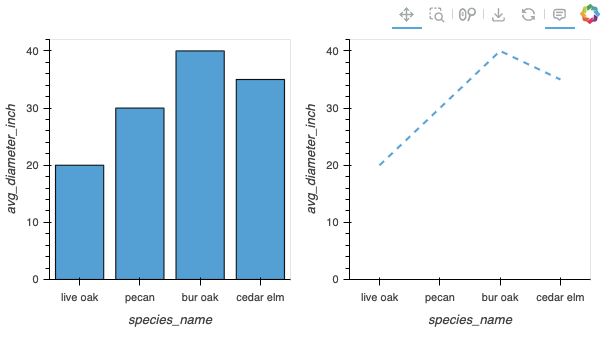
This interactive feature of Panel makes it possible to rapidly prototype and iterate on dashboards. Feel free to add more plots or different styles to your plots!
Deploy the dashboard
- JHub App Launcher
- CDS Dashboard
- On the Nebari Home Page (from JupyterLab, click on the Nebari logo in the top right corner or go to
File->Home) click on "Create App" to create a new web application for your dashboard. - Follow the general instructions from the JHub Apps documentation to fill out the
Create appform. - Click Next. You'll be redirected to the Spawner profile page. This page will allow you to select the server in which you want your app to run. These options will vary based on the setup of your Nebari deployment (which server types are available overall) and the permissions of your user (which server types you personally have access to).
- JHub App Launcher will deploy your app (which can take several minutes to complete) and automatically redirect you to it.
Your dashboard app will be available in the Nebari Home page, under "My Apps". If you allowed shared access, it will be available under "Shared Apps" for those with whom you have shared the app.
In this section, you'll use CDS Dashboards ((Nebari v2023.7.1 or earlier)) to publish and share your newly created panel dashboard.
CDS Dashboards has been deprecated in 2023.9.1. Nebari 2023.7.1 is the last release that support CDS Dashboards.
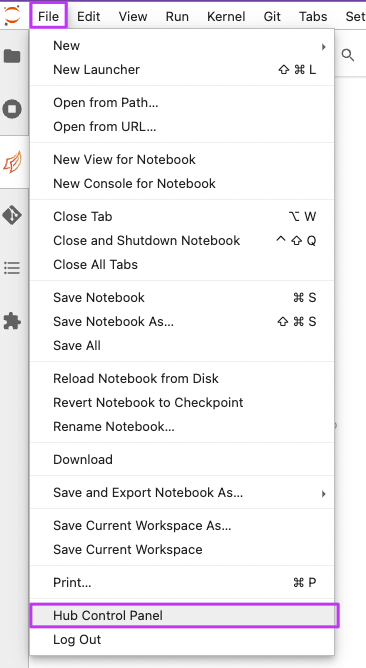
To begin, click on the top left tab navigate to File -> Hub Control Panel -> Dashboards.
Click on the button New Dashboard. You will now be presented with a new window where you'll need to provide additional details for your dashboard (see image below for reference).
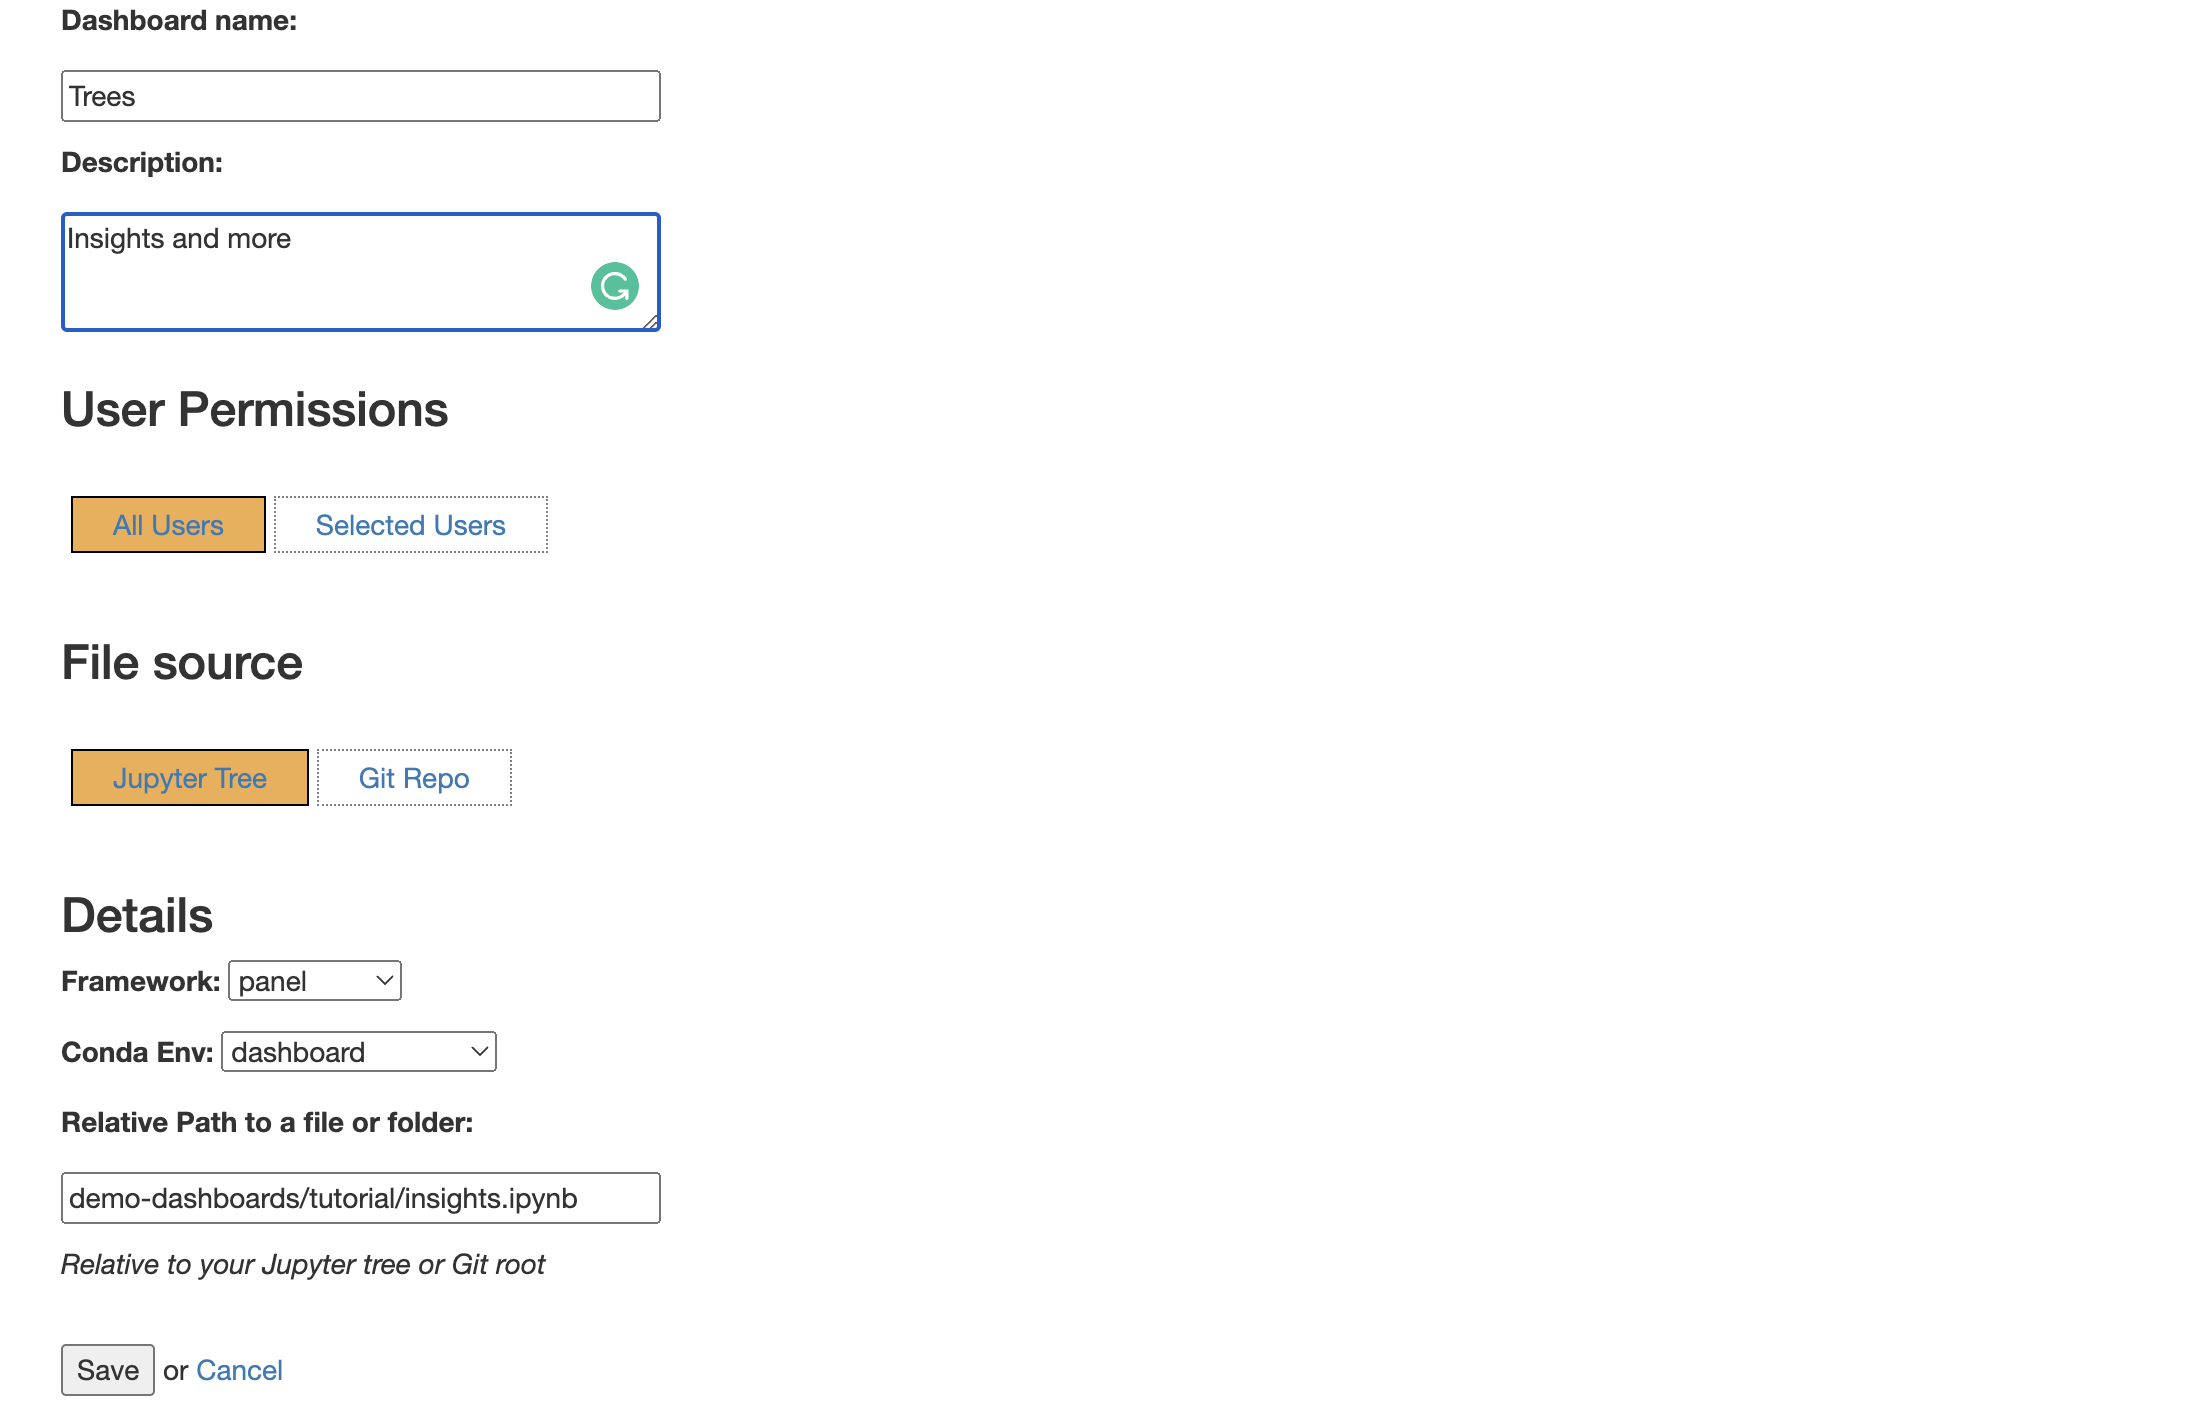
- Give your dashboard a name, for example,
Trees. This name will be the name of your shareable dashboard, so make sure to give this a meaningful name. - Add a short description, for example,
Insights and more. - Set the correct user-access permission (optional). This setting allows you to share your dashboard with all the other users on your Nebari deployment or select specific users.
- Select the code source for your panel. For example, in this tutorial you created a new notebook
panel-trees-dashboard.ipynb, but you can also point to a Git repository. - Select the appropriate framework for your dashboard, in this example you'll have to select:
panel. - Select the
condaenvironment for your dashboard, make sure it is same as the one you previously selected as your Jupyter notebook environment - In the
relative pathbox, copy your notebook's path (example:demo-dashboards/tutorial/panel-trees-dashboard.ipynb). - Once you have provided all the details above click on the save button.
You will then be redirected to a new window where you will be able to select the compute resources for your dashboard.
The available compute instances might vary depending on the configuration and cloud provider of your Nebari instance.
Also, the best instance type for your dashboard will depend on your specific use case.
An example of available compute instances available within a Nebari instance is shown in the following image:
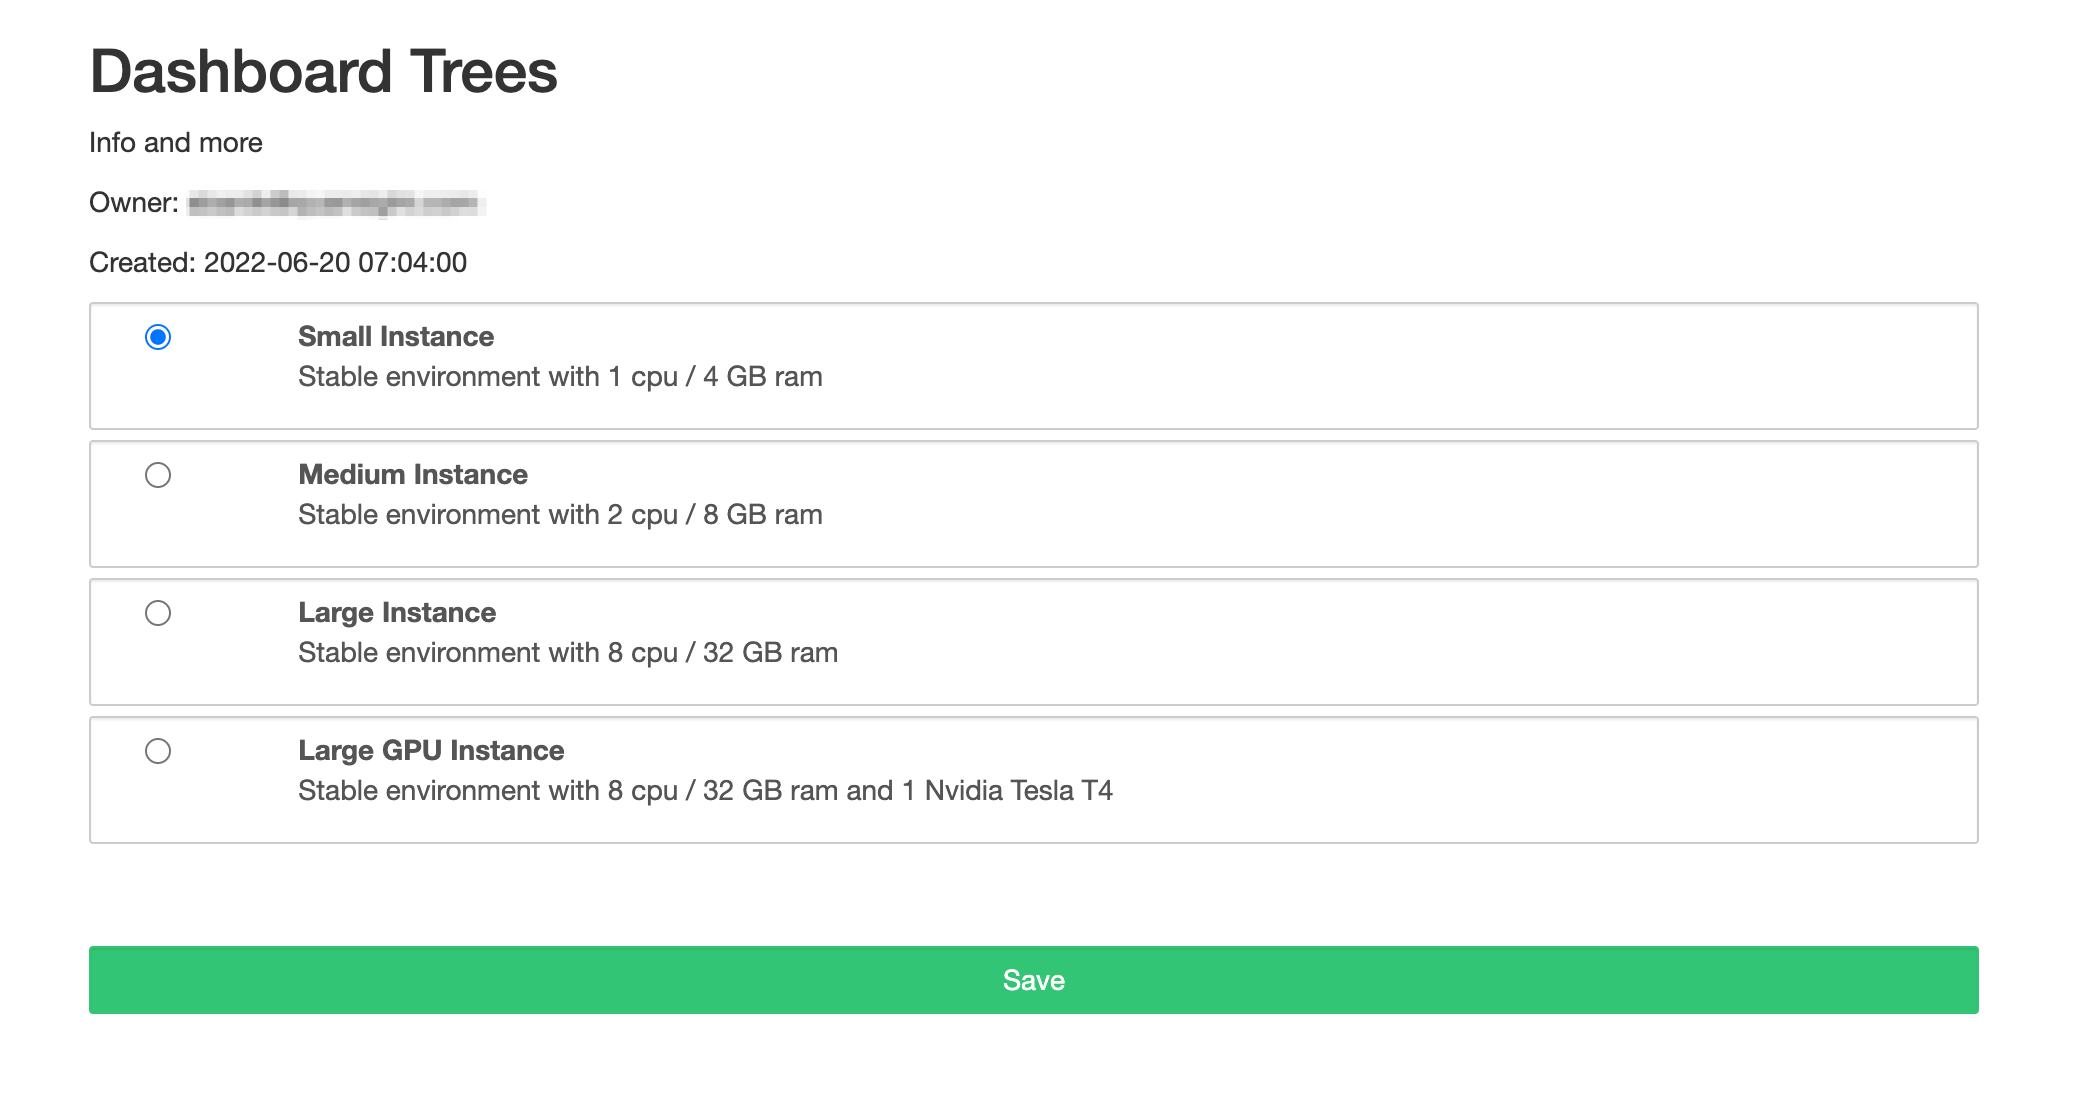
For this particular tutorial, a small instance should be enough. Once you have made a selection you can click on the Save button at the bottom of the window. This will trigger the deployment of your dashboard, and you'll be presented with a screen displaying the of this process.
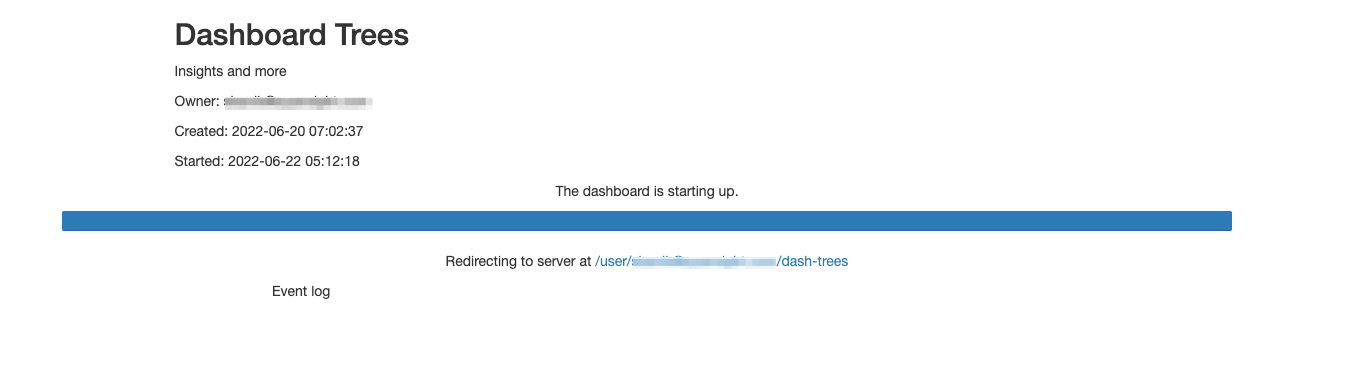
If there are no errors encountered during this process, you will be automatically redirected to the dashboard!
Manage apps in Nebari
- JHub App Launcher
- CDS Dashboards (Nebari v2023.7.1 or earlier)
All applications are available on the Nebari home page (from JupyterLab, click on the Nebari logo in the top right corner or go to File -> Home).
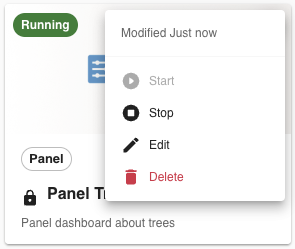
To manage an application, click on the three dots in the top right of the corresponding application card where you can:
- Start the app is it's not running
- Stop a running app
- Edit the application details
- Delete the app
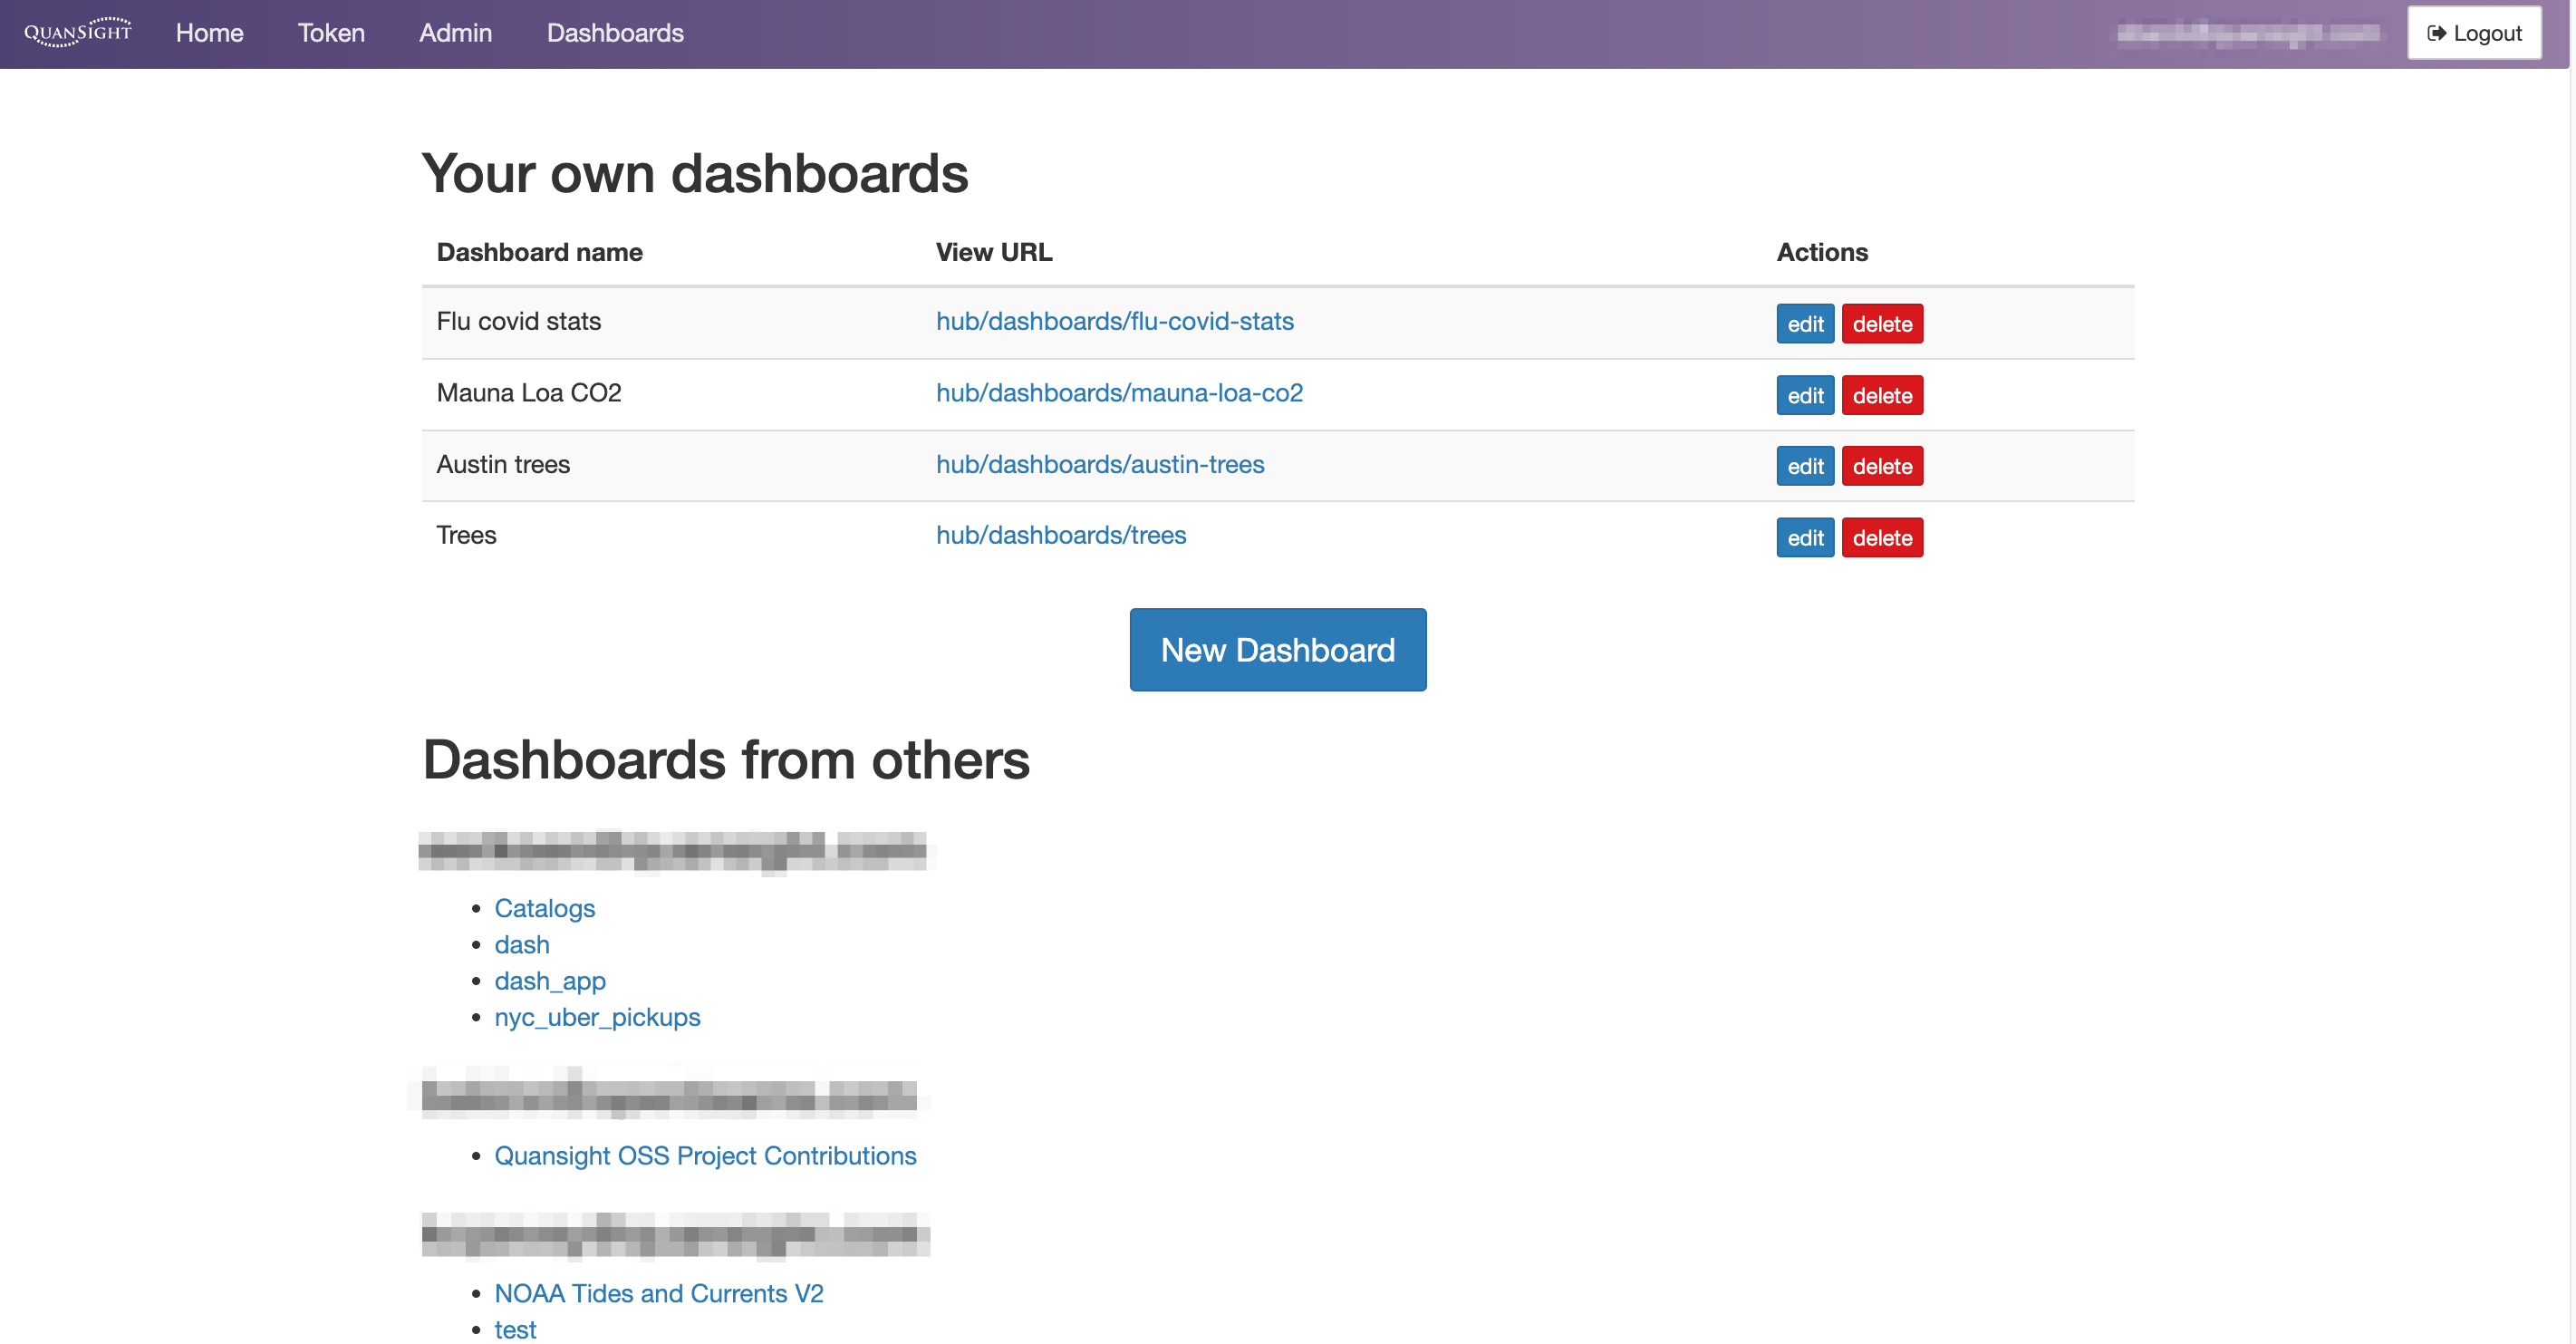
In the Nebari home page (from JupyterLab, click on the File menu tab, then select Hub Control Panel to go to the home page), click on Dashboards in the top navigation bar.
This will redirect you to Nebari's Dashboard main panel. Here, you can find the URL of your dashboards which can be shared with other users, as well as manage the status and deployment of your dashboards:
- To stop the dashboard server click on the
stopbutton. - To start the dashboard server click on the
startbutton. - To delete the server and the resources allocated click on the
deletebutton. - To make any changes to the existing CDS options, click on the
editbutton.
 .
.
While the dashboard is running, it will continue to consume resources. You should be mindful of the incurring ongoing costs while the dashboard is running, and stop it when not needed.
Dashboards and apps can be very handy tools to share information and insights with colleagues and external customers or collaborators. You can use this basic dashboard to build more complex dashboards, add more dynamic features, and start sharing data insights with others.